Record Activity & Audit Graph
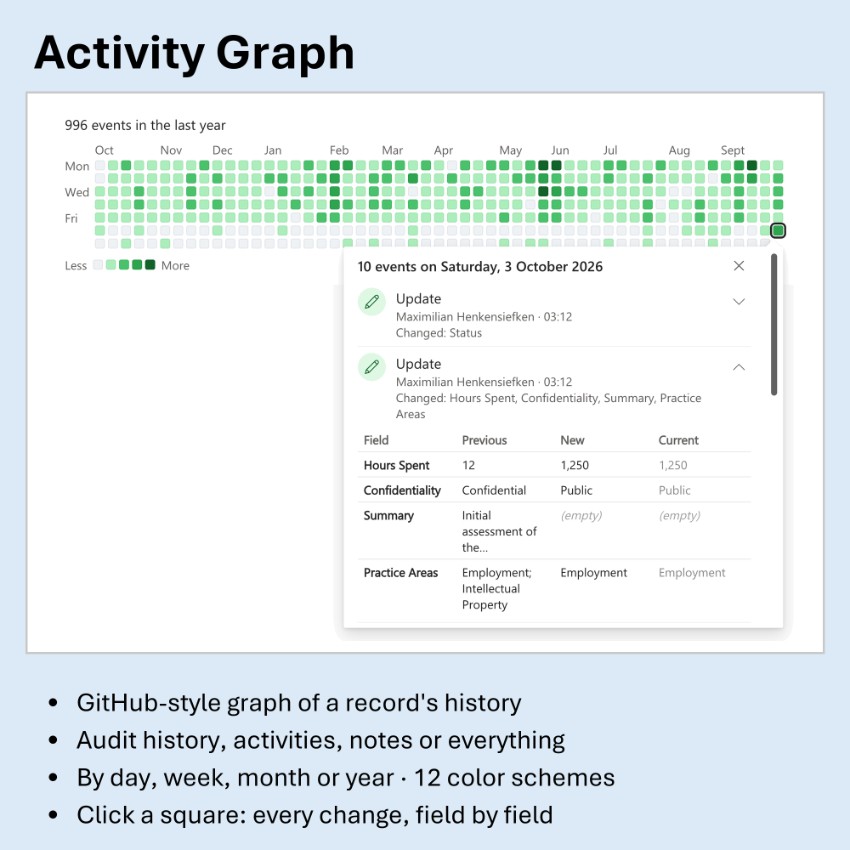
Record Activity & Audit Graph
A control that shows a record's history on a model-driven form as a GitHub-style contribution graph: one square per day, week, month or year, darker the busier it was. The history comes from the audit log, related activities, notes, or all of them. Click a square to see who changed what and when, and expand an audit entry to compare each field's previous, new and current value, formatted as on the form. Includes 12 color schemes and keyboard support, and follows the app's theme font. Ideal for seeing at a glance how active a matter, contract or case has been.
Author: Maximilian Henkensiefken
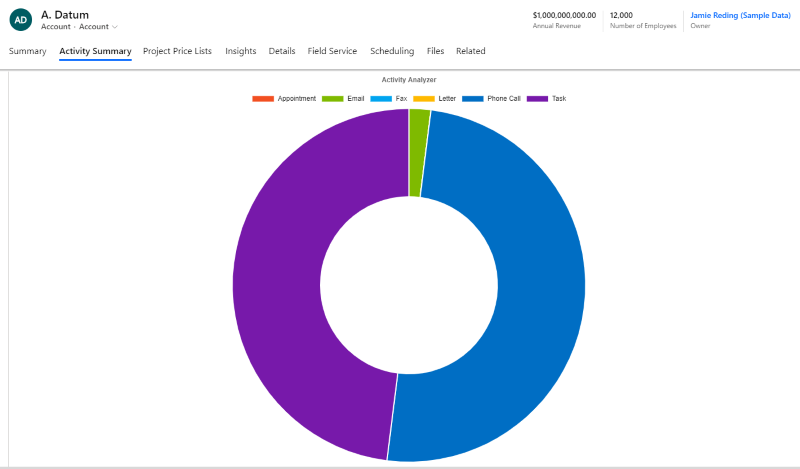
Activity Analyzer
A control to show activity subgrid in a doughnut chart using <a target="_blank" href="https://www
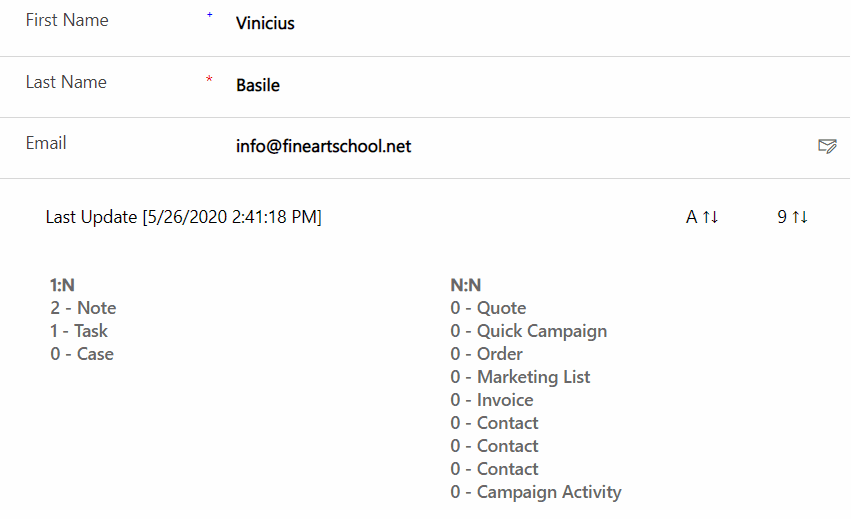
Relationships Count
A control to display the number of records that are related by entity (1:N) and relationships (N:N).
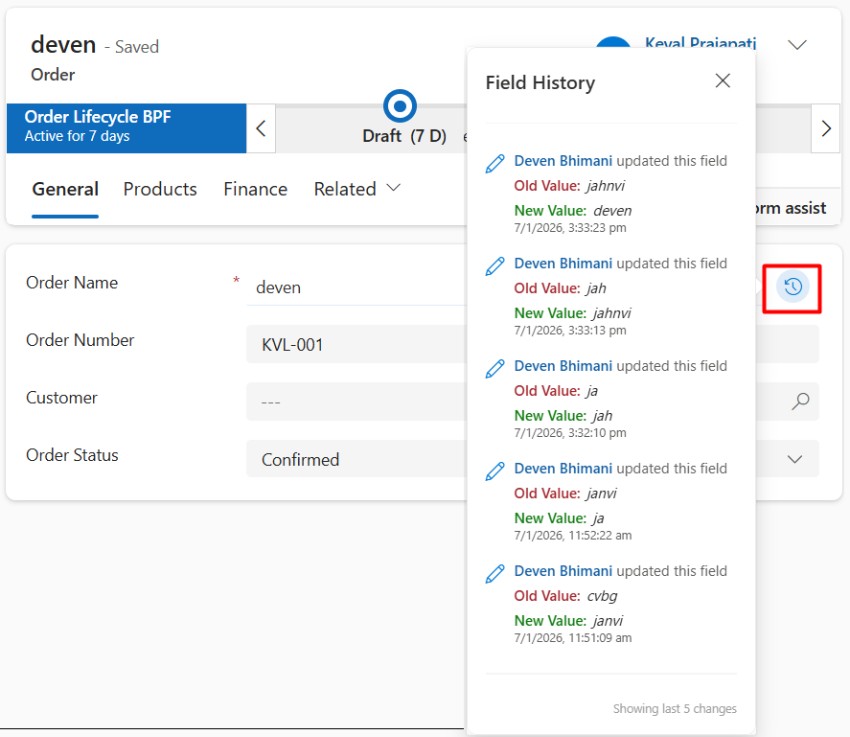
Field Audit
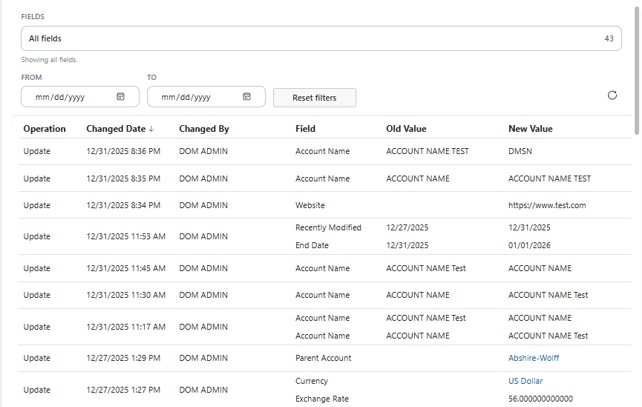
A control that provides instant visibility into a field's audit history directly within the form.
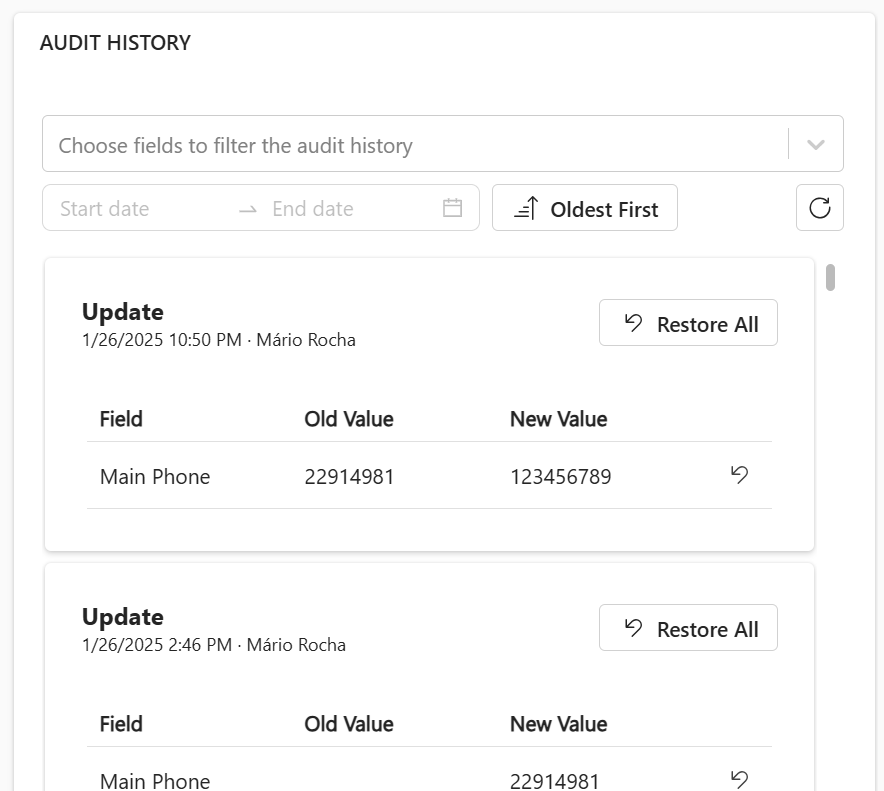
Audit History
A control designed to streamline the process of managing and visualizing audit logs in Dynamics 365